
Undvik dokumentkyrkogårdar med Content Services
Content Services Platforms
Sluta skapa dokumentkyrkogårdar. Med Content Services kan du ge liv åt dina information.
Swedwise Labs is our new forum for ideas, innovation, and education. For our first Lab, we tested Anypoint Platform as a weather station.
Swedwise Labs is our new forum for ideas, innovation and education. The goal of each lab-session is to have a working concept of a predetermined idea and should be developed in a single sprint. The Labs involve technologies within the range of our business areas but also cross borders to stimulate fresh ideas and exploration.
For our first Lab, we decided to put Mulesoft to the test as a weather station. With open meteorological data and through available APIs, we set out to find out whether there would be any precipitation within next three hours at a specific location, and then visualize the data.
For this lab, the goal was to retrieve some sort of data from several remote sources, and if necessary, sort and/or filter out parts of the retrieved data, then publish the results based on the retrieved data. What data should we use? Well, it’s been raining a lot here in Stockholm, so we decided to use open meteorological data. Swedish SMHI and Norwegian YR both provide APIs.
https://opendata.smhi.se/apidocs/metfcst/
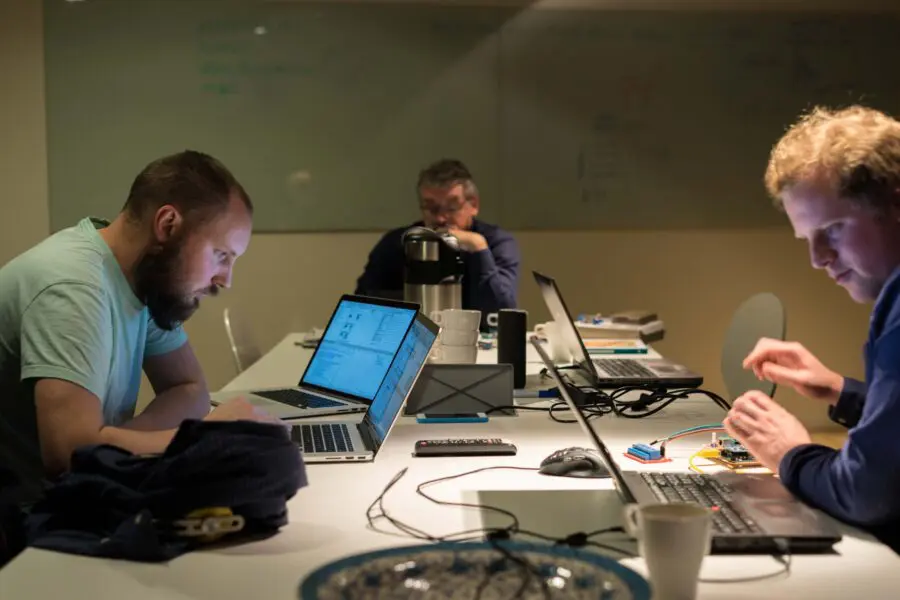
Our Lab Developers (right to left), John Hollingworth, Henrik Mörner, Pontus “Frank” Andersson.
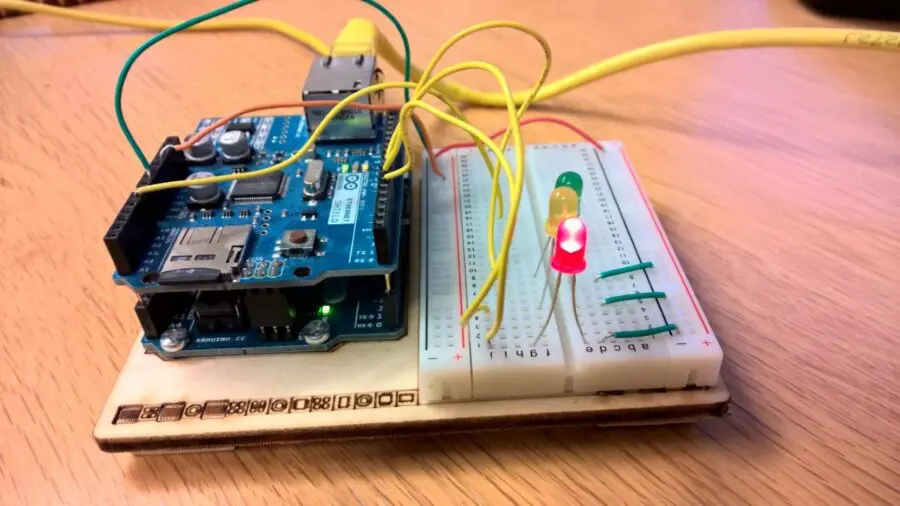
The Arduino UNO
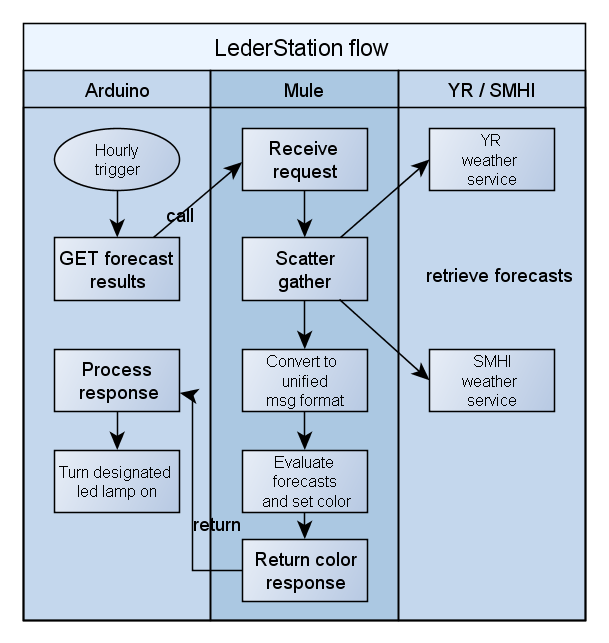
Mulesoft AnyPoint Platform acted as the main player to orchestrate the data flow. The Mulesoft Application listened, and reacted to user input from an Arduino client (which we had never programmed before). Upon request from the client, a ‘scatter gather’ process was initiated to retrieve the forecast data.
The results were combined into a unified JSON-object. A Python script processed the JSON-formatted data and calculated if precipitation was imminent and then returned one of the three colour codes back to the Arduino client via Mulesoft AnyPoint Platform, which then interpreted the response and lit up the corresponding led light.
Before we started, we only had the general idea of what to do. During a period of six hours, we decided upon a weather forecast service, and were then able to come up with the solution presented above, together with a working concept. In reflection, we needed a smaller client that got its coordinates from its current location. If we were to build a working physical prototype, then a well-designed object that could be placed say just outside a building’s entrance, which would tell you when to bring your umbrella – or not!
The Arduino UNO was connected to the Internet via an Ethernet Shield and was programmed to make a web-call to the Mule web server once every hour. The web server returned a value that translated to one of three colours: red, yellow or green depending on how high the risk for rain was at the time of the web call. Depending on the value we got in our response the lamp with the corresponding colour on the Arduino board was lit for one hour, displaying how high the risk of rain was for the next hour. After this the Arduino performed the next web call to refresh the value and continue displaying a light of some color.
The Mule application (RT 3.7), which main purpose was to receive a consumer call via REST service, perform a weather-forecast-retrieval from YR and SMHI, process the information and return a ”color-response”, whereby the different colors reacted if precipitation is inbound for the upcoming three hours, back to the consumer.
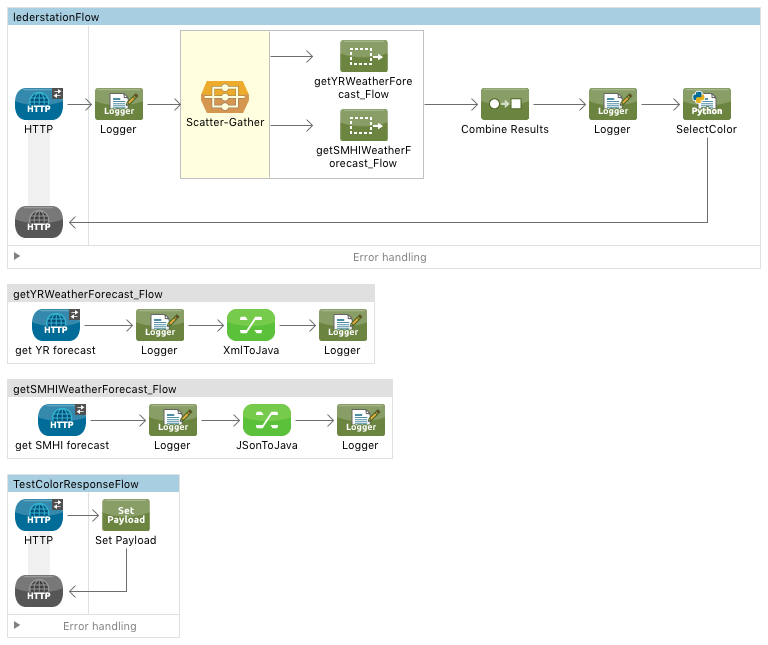
Main application flow created an http listener. Upon request from client (in this case, the Arduino client), a scatter gather process was initiated, which makes simultaneous requests to the YR- and SMHI-weather services (both being the most well-known forecast-suppliers in Sweden – no source needed). Once the scatter gather-process was successful, the result from both services was combined into a JSON-object. A Python script that calculated if precipitation was imminent returned a color, which was sent back to the client.
localhost: 8081
/api/lederstation
method GET
Subflow YR: get YR-weather forecast. Once a response was retrieved, the forecast for the three upcoming hours was selected and transformed the XML-response to a Java-object. This enabled us to combine the results from both sub flows into one object after the main scatter gather).
Host api.yr.no
path /weatherapi/locationforecast/1.9/
method GET
params_ lat=59.319478&lon=18.073891
SMHI: get SMHI-weather forecast. Once response was retrieved, the forecast for the three upcoming hours was selected and transformed the XML-response to a Java-object.
Host opendata-download-metfcst.smhi.se
path api/category/pmp2g/version/1/geopoint/lat/59.3194/lon/18.0738/data.json
method_ GET
Mock Service for Arduino-development enabled this side to test the Arduino solution at an early stage. Pass in color as parameter receives response from service with that color.
path /api/lederstation/test?color=yellow
The data manipulation was done with Python 3.4, which utilizes a built in JSON module. Python was chosen for learning purposes and ease of manipulating JSON data. Any scripting language or mapping engine compatible with Mule could have been used. The processing sorted out the precipitation values and calculated probability by comparing results from both data sets. A string with the resulting color was returned.
Content Services Platforms
Sluta skapa dokumentkyrkogårdar. Med Content Services kan du ge liv åt dina information.

Information Management
Förvandla NIS2-efterlevnad till en strategisk hörnsten i din informationshanteringsstrategi.

Enterprise Service Management
Skapa en AI-förberedd miljö med SMAX för bättre service management.